$ ls ~yifei/notes/
使用 Prometheus 监控应用数据
Posted on:
Last modified:
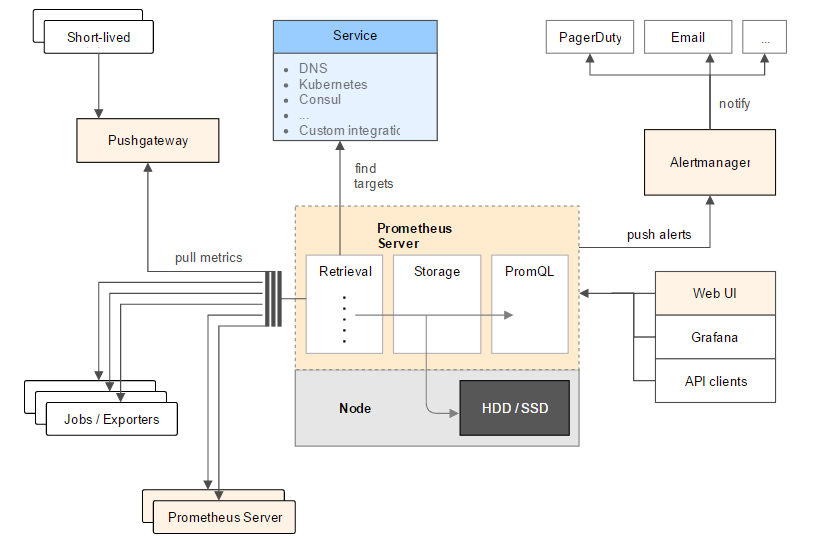
Prometheus 是使用 Go 语言开发的一个监控工具和时序数据库,它的实现参考了 Borgmon。监控 系统大体来说分两种模式,push 和 pull。push 模式指应用程序主动把监控数据推送到监控服务, pull 模式是监控服务来主动拉取应用的数据。Prometheus 采用的是 Pull 模式。
对于自己编写的应用,可以使用 prometheus 的 sdk 来主动提供 metrics,对于开源的软件,可以 使用对应的 exporter.
Prometheus 架构:
Prometheus 的指标类型
Prometheus 常用有四种类型:计数器/counter, 刻度/gauge, 直方图/histogram, 摘要/summary.
计数器只增不减,用来记录一件事情发生了多少次,可以使用 rate(some_counter[interval])
(具体含义后面会说到)来计算某件事情的速率。Counter 类型也主要是为了 rate 而存在的,即
计算速率,单纯的 Counter 意义不大,因为 Counter 一旦重置,总数就没有意义了。rate 函数会
自动处理 Counter 重置的问题,Counter 的任何减少都会被视为重置。
Gauges 可以直接设定,可以增大,可以减小。Gauge 用来记录状态,比如正在进行的请求的数量,
空闲内存数,温度等。对于 gauge 值,不要使用 rate, 可以使用 max_over_time 等来处理
gauge 数据。
Histogram 和 Summary 都是采样观测量,典型的如请求时间和相应的体积等等。他们记录观测到的
数量和观测到的所有值,允许你计算平均值等。Histogram 实际上是一个复合值,由三部分组成,一部分
是观测到的值,存在不同的 bucket 中,而 bucket 的大小则由用户指定,默认情况下是观测一个网页
请求的延迟。观测的数量(也就是_count) 变量是一个 counter 类型的值,当观测值没有负数的时候,
观测的和(也就是_sum) 变量也类似一个 counter。显然响应时间和响应体积都是正的。
Histogram 类型最常用的函数是 histogram_quantile,可以用来计算 P95, P99 等数据。
Histogram 在服务端计算,Summary 在客户端计算并且不能被重新计算。如果可能的话,最好使用 Histogram, 不要使用 summary. Summary 相当于客户端已经计算过的 histogram.
另外,Prometheus 支持 labels, 也就是标签,这样就可以很好地查询过滤指标,而不需要创建 很多的指标了。
比如,不要创建 http_response_500_total 和 http_response_403_total 这种指标,创建一个 http_response_total 指标,然后使用不同的状态码作为标签。然后你就只需要一个指标。
输出指标到 Prometheus
这里以 Python 为例。
pip install prometheus_clientCounter
from prometheus_client import Counter

# 按照 Prometheus 的最佳实践,counter 类型的数据后缀是 _total
# Prometheus 客户端会智能处理 _total 后缀,在后台总是有 _total 后缀的
c = Counter("http_request_failures_total", "http 请求出错计数")
c.inc()  # 默认是 1
c.inc(2)  # 也可以指定数字
Counter 还有一个方便的属性,叫做 count_exceptions, 可以用作装饰器或者 with 语句中。
@c.count_exceptions()
def f():
    pass

with c.count_exceptions():
    pass

with c.count_exceptions(ValueError):
    pass
Gauge
from prometheus_client import Gauge

g = Gauge("cpu_usage", "CPU 使用率")
g.inc()
g.dec(10)
g.set(4.2)
Gauge 也有一些方便的辅助函数,比如说 track_inprogress 用来记录正在执行的数量。
 g.set_to_current_time()

 # Increment when entered, decrement when exited.
@g.track_inprogress()
def f():
  pass

with g.track_inprogress():
  pass
也可以给 gauge 设定一个回调函数来取值:
d = Gauge('data_objects', 'Number of objects')
my_dict = {}
d.set_function(lambda: len(my_dict))
Histogram
值得注意的是,histogram 默认定义的 buckets 大小是为了常见网页请求时长设计的,也就是围绕着 一秒的一些数据。如果我们需要观测一些其他的值,那么需要重新定义 buckets 的大小。
一般来说,buckets 是呈指数分布的,中间值为最常见的典型值,这样可以更好地拟合实际的分布 (幂次分布)。因为 buckets 是以 label 的形式实现的,所以 buckets 最好也不要超过十个。
from prometheus_client import Histogram

h = Histogram()
h.observe(4.7)

@h.time()
def f():
  pass

with h.time():
  pass

# 默认的 buckets[0.005, 0.01, 0.025, 0.05, 0.1, 0.25, 0.5, 1, 2.5, 5, 10]
h = Histogram(buckets=[1, 10, 100])
labels
如果要添加标签的话,需要首先定义 labelnames,然后使用 labels 方法
from prometheus_client import Counter

c = Counter('my_requests_total', 'HTTP Failures', labelnames=['method', 'endpoint'])
c.labels(method='get', endpoint='/').inc()
c.labels(method='post', endpoint='/submit').inc()
HTTP 服务器
前面我们提到 Prometheus 采用拉模型,那么从哪儿拉数据呢?需要我们的程序开启一个 http 服务器,这样 Prometheus 才能来拉取数据。
如果是在普通的服务中,可以这样:
from prometheus_client import start_http_server

start_http_server(8000)
如果是运行时间很短的脚本,可能 Prometheus 还没来拉取监控数据,脚本已经工作结束退出了。 这种情况可以通过推送到 push gateway 来解决,Prometheus 可以配置成从 push gateway 抓取 数据。
from prometheus_client import CollectorRegistry, Gauge, push_to_gateway

registry = CollectorRegistry()
g = Gauge('job_last_success_unixtime', 'Last time a batch job successfully finished', registry=registry)
g.set_to_current_time()
push_to_gateway('localhost:9091', job='batchA', registry=registry)
如果本身就是一个 web 服务器,那么可以直接 mount 到一个路径。不过直接这样做是有问题的,因为 生产中的服务器都是多进程的,而 Prometheus 的 Python 客户端不支持多进程。可以使用一些开源的 exporter 并配合一些特殊设置。
以 gunicorn + fastapi 为例:
# 预先设置好 PROMETHEUS_MULTIPROC_DIR 环境变量,并且每次启动前清理这个目录

from fastapi import FastAPI
from starlette_exporter import PrometheusMiddleware, handle_metrics

app = FastAPI()
app.add_middleware(PrometheusMiddleware)
app.add_route("/metrics", handle_metrics)

# gunicorn 配置
from prometheus_client import multiprocess

def child_exit(server, worker):
    multiprocess.mark_process_dead(worker.pid)
使用 PromQL 查询指标
数据类型
在 Prometheus 中有四种数据类型,分别是:数字,字符串,直接向量 (instant vector) 和区间 向量 (range vector).
数字和字符串就不用说了,重点说一下后两个向量。直接向量就是指标,比如 http_request_count,
它就是一个一维的时间序列。而区间向量其实是二维的,在每一个时间点都是一个向量。
那么怎么生成区间向量呢?使用 [] 操作符。比如 http_requests_total[5m], 表示在每个时间点,
该时间点过去五分钟的时间序列,也就是二维的。那么区间向量有什么用呢?答案很简单:给 rate
函数使用。
比如,我们常见的计算网页 qps 的函数:rate(http_requests_toal[5m]), 意思就是,在每个
时间点都取前五分钟的统计数据计算访问速率,实际上这不就是求导么,而 5m 就是 dx 的取值。
但是,和微分不一样的是,dx 不是越小越好,因为 Prometheus 抓取数据有间隔,dx 不能 小于抓取间隔,所以一般取抓取间隔的 4 倍左右,确保即使抓取速度缓慢,且发生了一次抓取故障, 也始终可以使用两个样本。综上,5m 就是个很好的值。dx 如果设置的大一些,图像就会更平滑, 如果小一些就会更精确。
查询语法
查询语句语法:
<metric name>{<label name>=<label value>, ...}{} 用于过滤指标,类似 SQL 中的 where 子句。除了 = 之外,还有 != 和 =~(正则)和 !~(不匹配)
比如:
api_http_requests_total{method="POST", handler="/messages"}函数
如果有一个 histogram 观测值叫做 http_request_duration_seconds, 那么计算刚过去的 5 分钟
内的平均时长可以这样:
rate(http_request_duration_seconds_sum[5m]) / rate(http_request_duration_seconds_count[5m])操作符
Prometheus 中每个数据点都可以有不同的标签,我们称之为维度,可以使用操作符(operator)来 聚合不同维度的值。
使用 subm by/without 可以聚合字段:
# 保留 job 维度, 其他维度求和
sum by (job) (
    rate(http_requests_total[5m])
)
使用 Dashboard 展示指标
Prometheus 内置的可视化界面
Prometheus 在 /graph 下内置了一个 expression browser, 可以绘制一些简单的图形,除此之外
还是建议使用 Grafana.
数据采集配置
global:
  scrape_interval: 15s

scrape_configs:
  - job_name: prometheus
    static_configs:
      - targets: ["localhost:9090"]
对每一个 job 都会自动生成一些指标:
up{job="<job-name>", instance="<instance-id>"}: 1 if the instance is healthy, i.e. reachable, or 0 if the scrape failed.scrape_duration_seconds{job="<job-name>", instance="<instance-id>"}: duration of the scrape.scrape_samples_post_metric_relabeling{job="<job-name>", instance="<instance-id>"}: the number of samples remaining after metric relabeling was applied.scrape_samples_scraped{job="<job-name>", instance="<instance-id>"}: the number of samples the target exposed.scrape_series_added{job="<job-name>", instance="<instance-id>"}: the approximate number of new series in this scrape.
其中的 up 指标可以用来监控目标服务是否正常运行
合理使用标签
不要滥用标签,千万不要用 IP 或者 email 等字段来做标签,因为他们数量可能是无限的。这时候 就不应该用监控系统了,可能需要一些 OLAP 类型的分析工具了。
总的来说,把 metrics 的秩 (cardinality) 控制在 10 以下。整个系统要控制超过 10 的 metric 的 数量。绝大多数的查询不应该有标签。
为了避免秩过高的监控数据,可以添加如下的报警规则:
# 统计每个指标的时间序列数,超出 10000 的报警
count by (__name__)({__name__=~".+"}) > 10000
“坏指标”报警出来之后,就可以用 metric_relabel_config 的 drop 操作删掉有问题的 label(比如 userId、email 这些一看就是问题户)
如果不确定的话,首先别用标签,有了真实的 use case 再添加。
告警
Prometheus 使用 AlertManager 做告警。可以使用 predict_linear 等函数基于预测的做一些报警。
自监控
Prometheus 本身也需要监控,最简单的方法是两台独立部署的 Prometheus 互相交叉监控。每台 Prometheus 都拉取其余所有 Prometheus 的指标即可。
AlertManager 也需要做到 HA.
参考
- Should I run prometheus in a Docker?
- Logs and metrics and graphs, oh my!
- Developer Works 上的入门文档
- https://blog.frognew.com/2017/05/prometheus-intro.html
- https://github.com/yolossn/Prometheus-Basics
- https://mp.weixin.qq.com/s/sr8AxTMZTjUoe1XYrbRgyw
- https://zhuanlan.zhihu.com/p/24811652
- https://mp.weixin.qq.com/s?__biz=MzI4NTA1MDEwNg==&mid=2650782456&idx=1&sn=654615ca4199514687ae8ec65444dec9
- https://medium.com/@valyala/promql-tutorial-for-beginners-9ab455142085
- https://github.com/prometheus/client_python
- http://www.xuyasong.com/?p=1717
- https://www.section.io/blog/prometheus-querying/
- https://github.com/danielfm/prometheus-for-developers
- https://blog.viktoradam.net/2020/05/11/prometheus-flask-exporter/
- https://github.com/stephenhillier/starlette_exporter
- https://mp.weixin.qq.com/s/fDWcR99AWoKHgKRMwGom9w
- https://prometheus.io/docs/prometheus/latest/querying/functions/


© 2016-2022 Yifei Kong. Powered by ynotes
All contents are under the CC-BY-NC-SA license, if not otherwise specified.
Opinions expressed here are solely my own and do not express the views or opinions of my employer.
友情链接: MySQL 教程站