$ ls ~yifei/notes/
strace
Posted on:
Last modified:
尽管在线下会做充足的测试,但是线上出问题是难免的。当我们的程序在线上运行中遇到问题的时候, 而我们又没有日志可以观察到底哪里出了问题,这时候可以使用 strace 命令。strace 可以直接根据 pid 附着到进程上,打印出进程的一些统计信息,为排查 bug 提供有意义的参考。
Strace 的选项
- c – See what time is spend and where (combine with -S for sorting)
- f – Track process including forked child processes
- o my-process-trace.txt – Log strace output to a file
- p 1234 – Track a process by PID
- P /tmp – Track a process when interacting with a path
- T – Display syscall duration in the output
Track by specific system call group
- e trace=ipc – Track communication between processes (IPC)
- e trace=memory – Track memory syscalls
- e trace=network – Track memory syscalls
- e trace=process – Track process calls (like fork, exec)
- e trace=signal – Track process signal handling (like HUP, exit)
- e trace=file – Track file related syscalls
Trace multiple syscalls
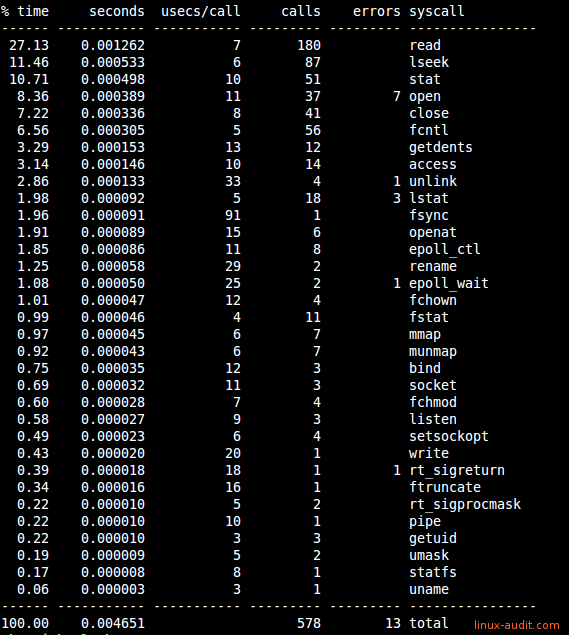
strace -e open,close统计进程系统调用花费时间
strace -c -f -p 11084一般来说要加上 -f 选项,这样才能跟踪多进程程序,也就是 fork 之后的进程。
strace -o output.txt -T -tt -e trace=all -p 28979使用和这个命令可以统计每一个系统调用的时间
- 使用 struss 查看系统问题
- strace 的详细用法
- https://blog.csdn.net/budong282712018/article/details/83151953
- https://blog.csdn.net/maple_leaves_for_me/article/details/42391979
- https://blog.51cto.com/5iwww/771031
- https://blog.csdn.net/lotluck/article/details/77943152
- https://linux-audit.com/the-ultimate-strace-cheat-sheet/
- http://try-linux.blogspot.com/2013/12/how-to-strace-process.html
- https://zwischenzugs.com/2011/08/29/my-favourite-secret-weapon-strace/


© 2016-2022 Yifei Kong. Powered by ynotes
All contents are under the CC-BY-NC-SA license, if not otherwise specified.
Opinions expressed here are solely my own and do not express the views or opinions of my employer.
友情链接: MySQL 教程站